1. Case Overview
The customer needed enterprise-wide strategic and operational quality assurance and defect reporting, for standard measures like Defects Per Unit, First Pass Yield and Defects per Million Opportunities. The desired solution had typical requirements like:
Reporting from the highest level (division, manufacturing site, program, product line) down to the lowest level (router, operator, operation, SFC, defect description), with drill-downs through all levels between.
Speed of execution, a challenge in an environment with literally millions of new manufacturing operations performed monthly.
Ability to define which shop floor operations constituted which test types, for the purposes of yield reporting (e.g., first test, final test, circuit test, etc.).
Configurability of reporting views by engineers who are responsible for changing Reportable Items (subset of full BOM), specification of operations for “yield types”, etc., without IT intervention.
Ad-hoc reporting
Custom algorithms for measures like DPU, First Pass Yield, etc. in order to provide adequate representation to subassemblies which may have less components than other subassemblies of the same end item.
2. Problem Detail
The customer was trying to satisfy these requirements using Cognos, an off-the-shelf BI and reporting tool, connected directly to the detailed shop floor operation level database. The most obvious shortcoming was performance. Since Cognos’ query generation engine was tasked with summarizing tens of millions of rows to produce a report like “Defects per Unit by Site by Month”, results took hours if they ever returned, and running even 10 reports at once would crash the server.
In addition, the hierarchical reporting structures required heavy hands-on IT involvement.We referred to this problem as “Reporting Hierarchies and their node population”. A reporting hierarchy would be, for example:
Division -> Program -> Product -> Major Assembly -> Subassembly
or
Factory -> Work Group -> Item -> DefectType
Different kinds of hierarchies were needed for different functions (COO, Quality Directory, Manufacturing Line Engineer), and even within the same function, differed between different product lines.
“Node population” refers to defining which shop floor controller operation-level event rows belonged to which nodes of these hierarchies. For DPU reporting, this was generally determined by the site where the item was manufactured, the item number or the first n characters of an SFC (SFC being a sort of ‘serial number’ for each component or assembly on the floor, constructed as item number plus a suffix). Occasionally the actual shop floor operation name served as part of the filter as well. Only specifically selected rows, as defined by these filters, were desired for most of this ‘hierarchy reporting’, with all others intentionally disregarded to eliminate chatter.
So, for example, which items on which components constitute a reportable subassembly, which subassemblies rolled up into major assemblies, which major assemblies constitute an end item, and how do end items roll up, respectively, into programs, product lines and divisions? The hierarchy definitions were beyond Cognos’ capabilities, so a new process within IT had been created to handle this need.
The hierarchy construction (definition of levels and their names) and the rules to populate them, were being decided upon by manufacturing and quality SMEs, then provided to IT where they were manually input. Each hierarchy was then maintained in its own separate Visual Basic code branch, necessitated by the inherently different structures of the hierarchies as noted above. Each VB program generated reports for one hierarchy, and was executed manually each week to generate static reports. Ad-hoc reports based on these hierarchies were not available. In addition, new programs were being brought up continuously, requiring new spinoffs of code bases, and excessive IT resources.
3. The Solution
We broke the challenge up into 2 general areas: performance and report hierarchy configuration (definition and node population). Once the system was fast enough and allowed easy hierarchy definition, the aspects of ad-hoc reporting, drilling up and down between levels, subsetting of operations for yield types, and custom metrics definitions (e.g., how is DPU computed for program A vs. Program B), could then be added.
Performance:
The first question we asked was which levels of detail are necessary and when? Our investigation revealed the following: Summarizations of metrics (DPU, FPY, etc.) were only done at the weekly, not daily level, and only involved some, not all, of the attributes kept at the shop floor operation transaction level. Generally, manufacturing site, item, SFC wildcard (first 7 characters), operator, operation, router, defect type, and a few others were necessary to DEFINE THE REPORTING HIERARCHIES or PROVIDE FILTERS and GROUPINGs FOR AD HOC reports.
Based on this, we designed a “summary” database, loaded nightly, which summed operations and defects by week for all these necessary attributes, but no others. In other words, one row was created for each unique combination of:
- WEEK
- SITE
- ITEM
- WORK CENTER
- OPERATION
- SFC WILDCARD (BASE SFC)
- ROUTER
- DEFECT TYPE
- FIRST PASS FLAG (was this the first operation of this type for this set of attributes)
with the measure columns of:
- SUM (OPERATIONS)
- SUM (DEFECTS)
This summary database resulted in about a 1,000x reduction of row counts vs. the shop floor controller database, and its query performance became acceptable for our reporting solution.
If desired, further details could be provided for supervisors, manufacturing engineers, and others interested in the result of a specific operation, when necessary, by using attributes associated with any summary report cell to build a query which directly accessed the shop floor controller database. In other words, our general reporting (summary) database and our detailed view (shop floor) database were 2 separate connections within our tool.
This “summary database” approach is not unique and they are often developed and used in conjunction with off-the-shelf BI tools. However, the fact that we had to connect the summary database to the detail database (drill through), needed a custom report hierarchy definition UI, and needed to have specific metrics roll-up rules for different organizations throughout the enterprise, led us to our solution of creating a custom BI tool built specifically for this customer’s shop floor system, which was Visiprise Manufacturing (now SAP Manufacturing module).
Reporting Hierarchies:
In order to address the fluidity of the reporting hierarchies and their node population, our custom solution provided the following UIs:
Report Hierarchy Setup UI (with note annotations in RED):
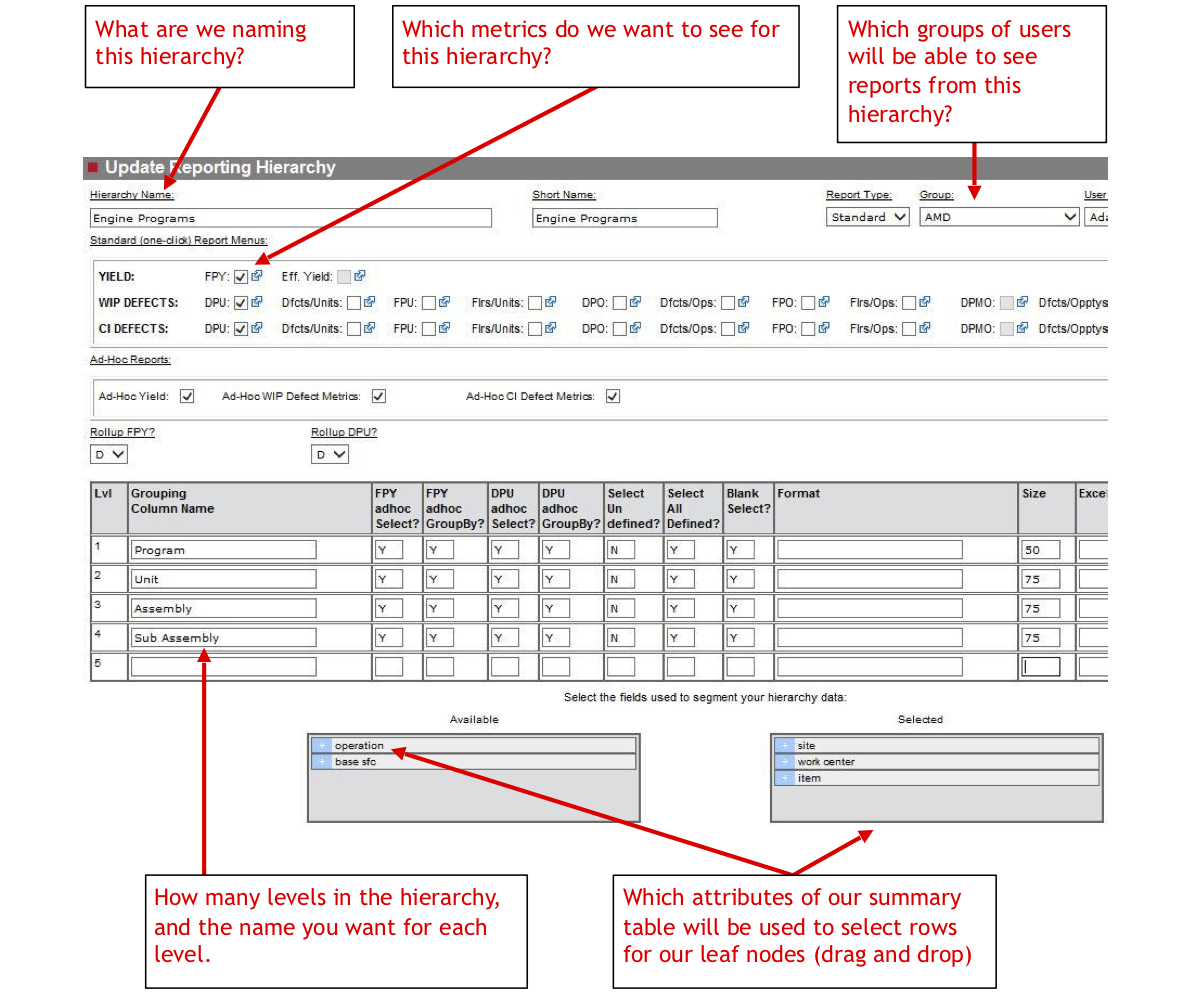
Using the above screen, the specific hierarchy definitions were set up, named, their reporting levels named, and the specific attributes which would be used to supply the leaf nodes, were identified.
Based on the values supplied via the UI above, the following screen was then auto-generated which allows for population of the nodes filters, using values supplied for the attributes selected in the “drag and drop”:
Hierarchy Node Filter UI (with notes in RED):
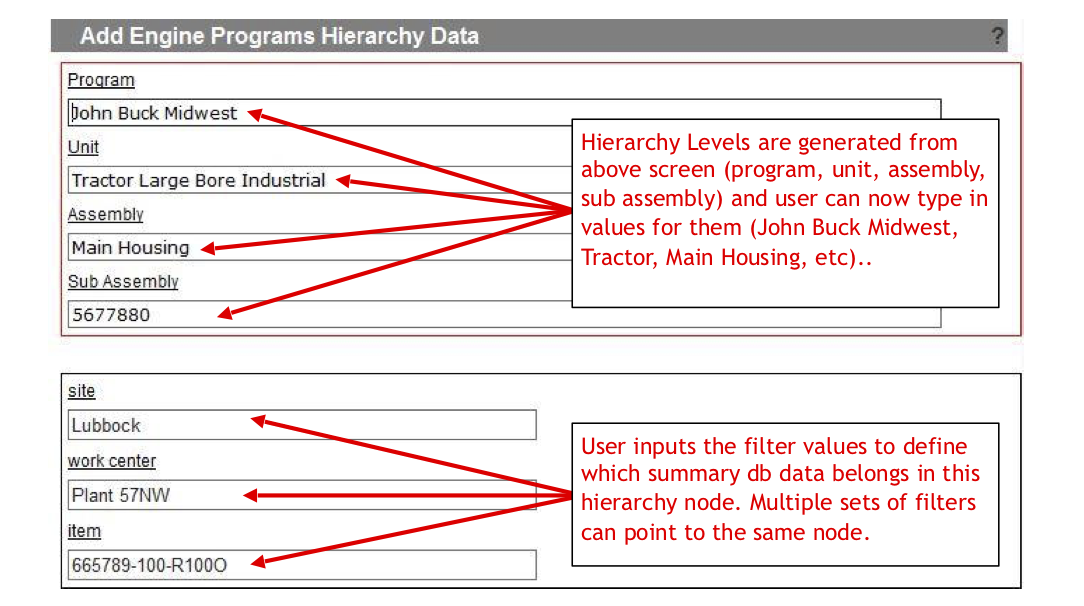
This data can also be loaded through the UI via an Excel spreadsheet. So for our customer, the SMEs could maintain and upload the spreadsheet as needed.
Sample of partially built out hierarchy nodes and their filters:
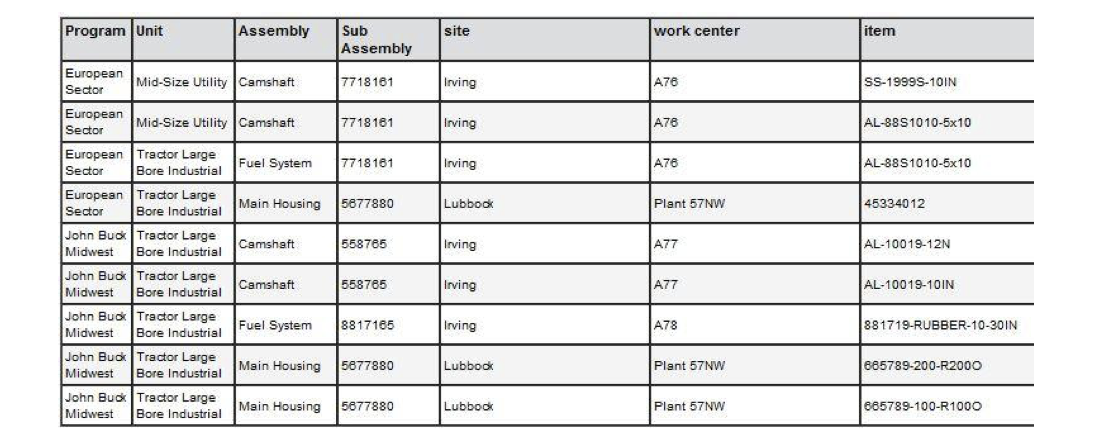
So, within our ‘Engine Programs’ hierarchy we have specified 2 PROGRAMS (hierarchy level 1), the first with 2 UNITS and the second with 1 UNIT (hierarchy level 2), also levels 3 (assembly) and 4 (subassembly), and values for the filters on SITE, WORK CENTER and ITEM, for the various levels.
Within our application, we did not have to actually ‘populate’ the node data. It is not materialized. We just use the filters to pull the data from our summary database in real time.
For example, to retrieve data for all assemblies for our Engine Programs hierarchy, Program = 'European Sector' , Unit='Mid-Size Utility', for all assemblies and subassemblies, our code dynamically construct the following query:
SELECT * FROM
HIERARCHY_TABLE HFT INNER JOIN SUMMARY_TABLE ST ON
	HFT.FILTER1VAL = ST.SITE
	AND HFT.FILTER2VAL = ST.WORKCENTER
	AND HFT.FILTER3VAL = ST.ITEM
WHERE HFT.HIERARCHY_NAME='Engine Programs'
    AND HFT.LEVEL1_NAME='European Sector'
    AND HFT.LEVEL2_NAME='Mid-Size Utility';
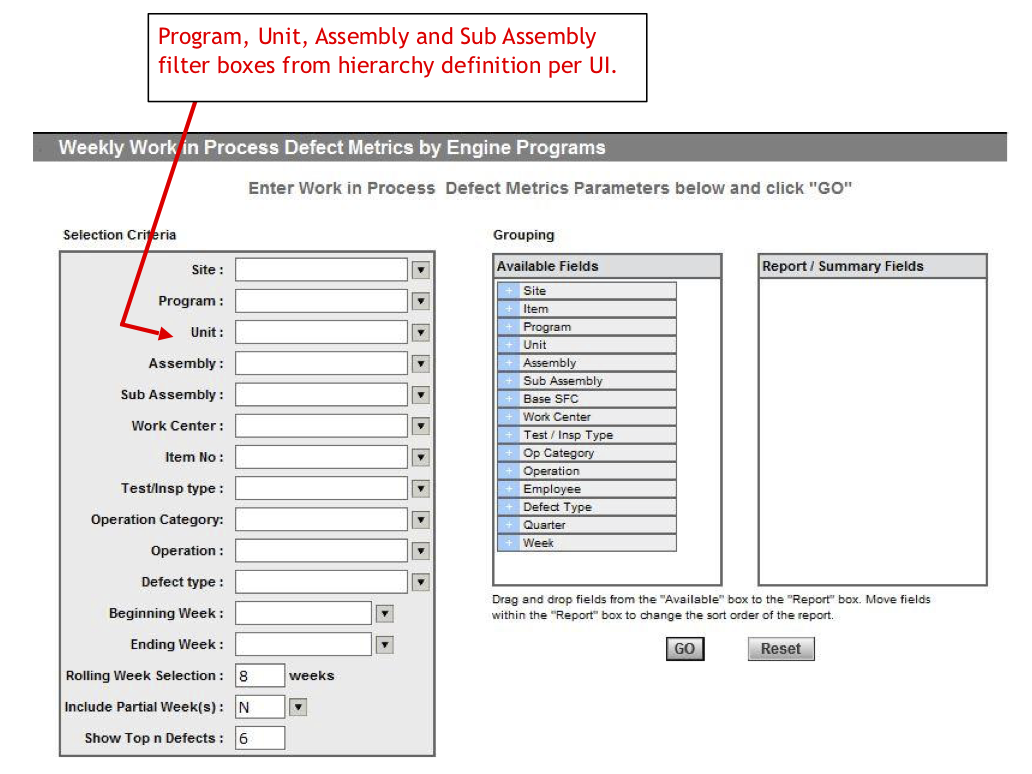
We built our reporting app to automatically generate standard reports and ad-hoc reports for each defined hierarchy, on the Main Reporting Portal Page. Therefore the Engine Programs Hierarchy now appears with both Standard and Ad-Hoc Reports, for each desired metric. This feature essentially replaced and extended the Visual Basic code branches previously required for each hierarchy. In short, our hierarchy definitions were data-driven and input via UI, not hard-coded in VB.
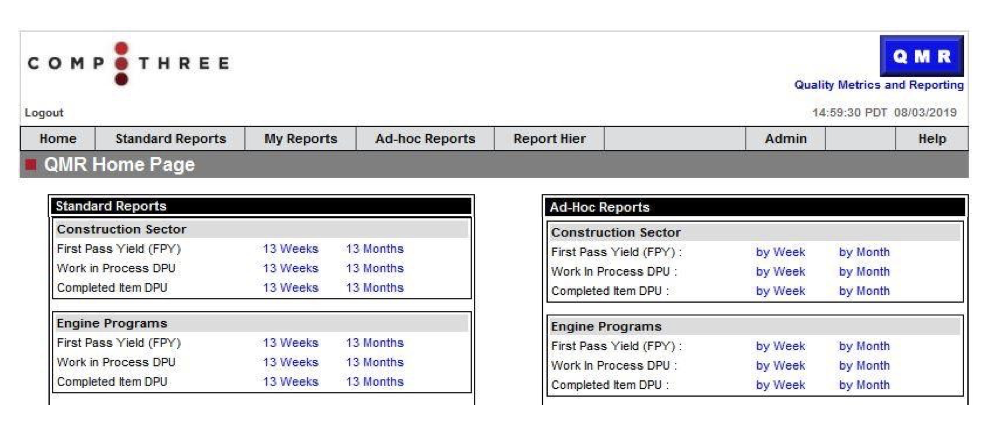
Both the Standard and Ad-Hoc reports make use of the Hierarchy structure definitions to allow the user to select from within the Hierarchy’s user-defined levels, as shown:
Standard Reports UI as auto-generated by app for ‘Engine Programs’:
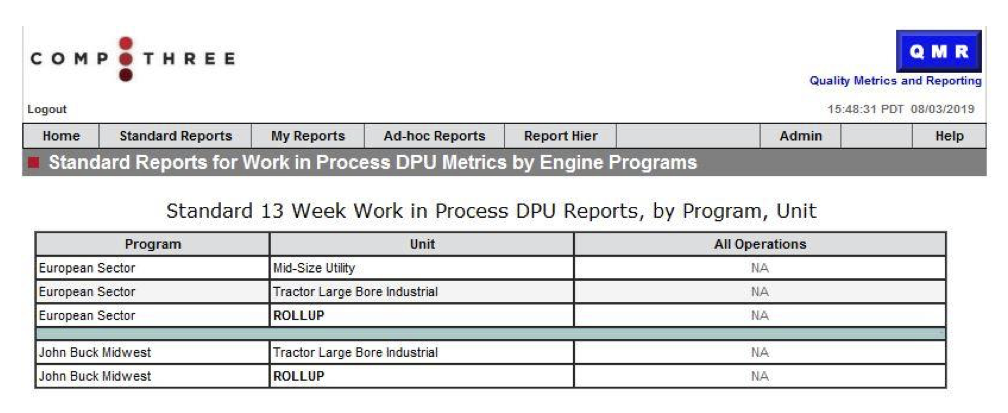
Selection of any Unit (level 2) would bring up a report dashboard showing detail at subsequent levels (in this case assembly and subassembly) and roll-up graphs by unit. Drill downs (to shop floor DB) were then available from each report cell.
Ad-Hoc UI as auto-generated by app for ‘Engine Programs’:
4. Conclusion
This case study illustrates a situation where reporting requirements were too complex to handle with any COTS BI tool available at the time of the project, and a custom one was built instead. By providing an abstraction layer for the user’s report hierarchies we were able to replace numerous VB applications with a single tool, yet still support the different reporting needs across divisions, programs, and functional areas, with a single tool. The time to bring a new program’s reports on-line was greatly reduced.
By summarizing the source data and storing into a separate DB we were able to meet the performance requirements as well.
Enter your email below:
